Hotels · XLSX
Free Hotel Daily Operations Report Excel Template for 2026
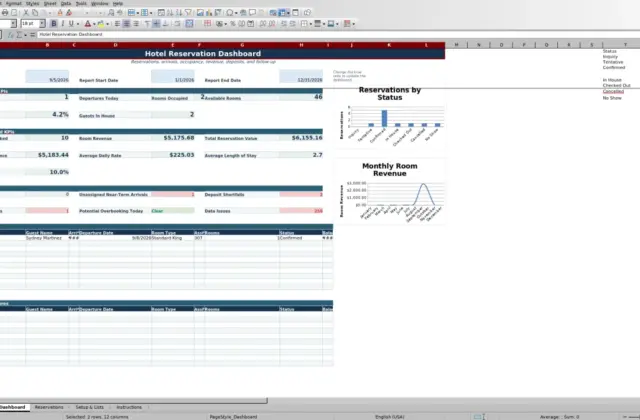
Hotel daily operations report with occupancy, ADR, RevPAR, revenue, labor, cash variance, incident tracking, and dashboard summaries.
Formula and workbook structure checked before publication
This hotel daily operations report is a free Excel template for organizing a property’s room activity, revenue, labor, cash, guest service, maintenance, and incident information by operating date.
The workbook contains four sheets: Dashboard, Daily Operations, Incident Log, and Instructions. Managers can enter daily figures in one row, review calculated hotel metrics, monitor follow-up items, and compare results with editable operating targets.
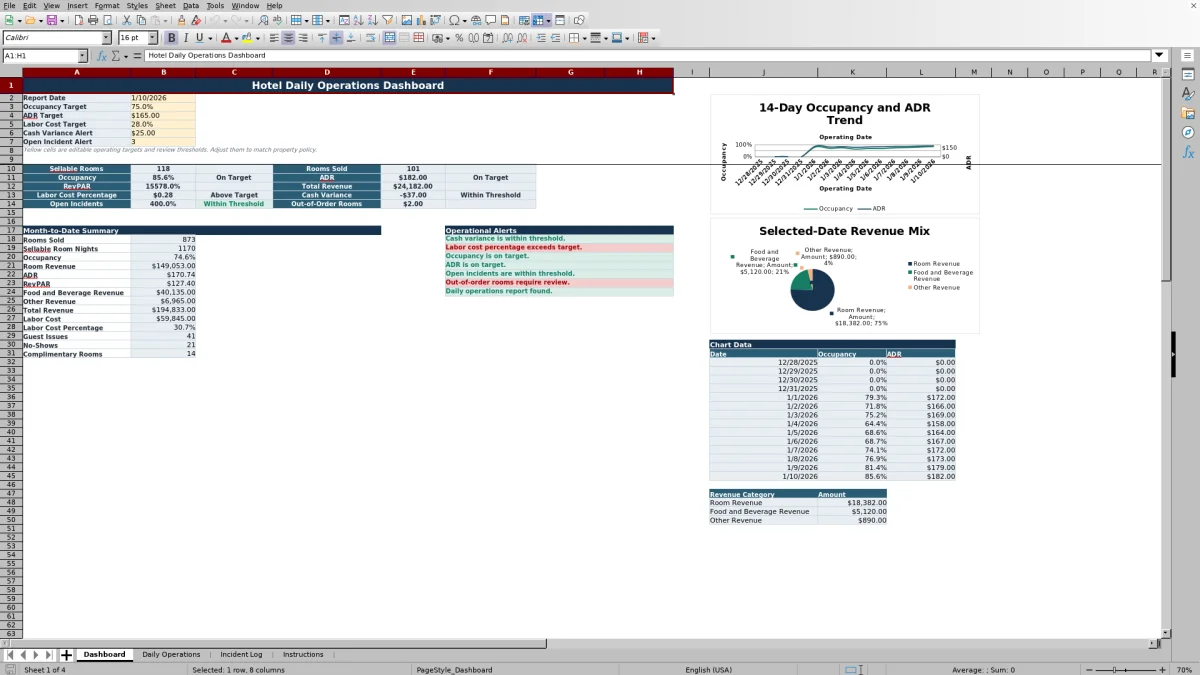
Built-in formulas calculate sellable rooms, occupancy, ADR, RevPAR, total revenue, labor cost percentage, and cash variance. The Dashboard presents selected-day results, a month-to-date summary, operational alerts, an occupancy and ADR chart, and a revenue category chart.
At a glance
What this workbook helps you manage
- Keeps rooms, revenue, labor, cash, and operating activity in one dated report.
- Calculates core hotel metrics consistently from entered daily figures.
- Shows selected-day and month-to-date performance on a management dashboard.
- Connects incident ownership and follow-up status with the daily review process.
See the actual file
Inside the workbook
Included in the file
- Four sheets: Dashboard, Daily Operations, Incident Log, and Instructions.
- Automatic calculations for seven daily operating and financial measures.
- Editable Dashboard targets and thresholds with conditional status messages.
- Filtered Daily Operations and Incident Log tables with validated entry fields.
How to use the template
1. Review the instructions and operating targets
Start on the Instructions sheet to review the daily workflow, metric definitions, and color key. On the Dashboard, set the Report Date and adjust the yellow target or threshold cells for occupancy, ADR, labor cost percentage, cash variance, and open incidents. These values should reflect property policy and the management team’s review standards.
2. Enter one row for each operating date
Use the Daily Operations sheet for the manager on duty’s daily report. Enter the operating date, manager name, total rooms, out-of-order rooms, rooms sold, complimentary rooms, and room revenue. Then add food and beverage revenue, other revenue, refunds and adjustments, arrivals, departures, no-shows, walk-ins, and guests in house.
Complete the operating detail with labor hours, labor cost, expected cash, counted cash, open work orders, guest issues, housekeeping rooms cleaned, Daily Status, and management notes. The sheet provides status choices of Draft, Submitted, Reviewed, and Final.
3. Review calculated metrics and exceptions
Blue-gray cells calculate automatically. Confirm occupancy, ADR, and RevPAR, along with sellable rooms, total revenue, labor cost percentage, and cash variance. Check unusual results against the source figures entered for that date rather than typing over calculated cells.
- Sellable Rooms equals Total Rooms minus Out-of-Order Rooms.
- Total Revenue adds room, food and beverage, and other revenue, then subtracts refunds and adjustments.
- Cash Variance equals Counted Cash minus Expected Cash.
4. Record incidents and assign follow-up
Use the Incident Log for events requiring documentation, ownership, or further action. Record the incident ID, reported date and time, category, priority, status, property area, room or location, summary, immediate action, owner, due date, estimated cost, manager review, and notes. Add a resolved date when applicable.
The sheet calculates days open and labels follow-up as Completed, No Due Date, Overdue, Due Today, or Open based on the entered dates and status. Continue to follow property procedures for emergencies and any separate required reporting.
5. Complete the management review
Select the applicable Report Date on the Dashboard. Review the daily indicators, month-to-date totals, charts, and operational alerts. Resolve questionable entries or follow-up needs before changing the Daily Status to Final after management review.
What does the hotel daily operations report track?
The Daily Operations sheet combines information commonly reviewed during a hotel’s daily handoff or manager review. Room inventory fields include total rooms, out-of-order rooms, sellable rooms, rooms sold, complimentary rooms, and housekeeping rooms cleaned. Front office activity covers arrivals, departures, no-shows, walk-in reservations, and guests in house.
Financial fields include room revenue, food and beverage revenue, other revenue, refunds and adjustments, total revenue, labor hours, labor cost, expected cash, counted cash, and cash variance. Open work orders, guest issues, Daily Status, and management notes provide operating context for the numbers.
Which hotel KPIs does the Excel workbook calculate?
The workbook calculates seven daily measures from the entered data: sellable rooms, occupancy, ADR, RevPAR, total revenue, labor cost percentage, and cash variance. Formula cells remain blank when an operating date has not been entered, and error handling prevents calculation errors from filling the report.
Occupancy divides rooms sold by sellable rooms. ADR divides room revenue by rooms sold, while RevPAR divides room revenue by sellable rooms. Labor cost percentage divides labor cost by total revenue. These definitions also appear on the Instructions sheet so managers can review how each result is produced.
How does the Dashboard support the daily hotel meeting?
The Dashboard uses the selected Report Date to summarize sellable rooms, rooms sold, occupancy, ADR, RevPAR, total revenue, labor cost percentage, cash variance, open incidents, and out-of-order rooms. It compares results with the editable targets and thresholds and displays messages such as On Target, Below Target, Above Target, Within Threshold, Review Variance, or Action Needed.
A month-to-date summary covers rooms sold, sellable room nights, occupancy, room revenue, ADR, RevPAR, food and beverage revenue, other revenue, total revenue, labor cost, labor cost percentage, guest issues, no-shows, and complimentary rooms through the selected report date. Two charts use Dashboard data to display occupancy and ADR over dates and amounts by revenue category.
How are hotel incidents and follow-up actions managed?
The Incident Log separates operational events from the daily numeric report while keeping unresolved items visible to management. Available categories are Guest Service, Maintenance, Housekeeping, Safety, Security, Food and Beverage, Technology, and Other. Priority options are Low, Medium, High, and Urgent; status options are Open, In Progress, Monitoring, Resolved, and Closed.
Each entry can identify the property area, room or location, immediate action, action owner, follow-up due date, resolved date, estimated cost, and manager review status. The calculated follow-up status helps distinguish completed incidents from open, due-today, overdue, or undated items. The Dashboard’s open-incident count excludes incidents marked Resolved or Closed.
Questions about this workbook
What sheets are included in the hotel daily operations report template?
The Excel workbook includes four sheets: Dashboard, Daily Operations, Incident Log, and Instructions. The Dashboard summarizes performance, Daily Operations holds one row per operating date, Incident Log tracks events and follow-up, and Instructions explains the workflow, calculations, and color key.
Does the template calculate occupancy, ADR, and RevPAR?
Yes. Occupancy is rooms sold divided by sellable rooms, ADR is room revenue divided by rooms sold, and RevPAR is room revenue divided by sellable rooms. Sellable rooms are calculated as total rooms minus out-of-order rooms.
Can managers adjust the hotel performance targets?
Yes. Yellow cells on the Dashboard hold editable values for occupancy target, ADR target, labor cost target, cash variance alert, and open incident alert. The associated Dashboard formulas use these values to display review messages.
What information is included in the month-to-date summary?
The summary includes rooms sold, sellable room nights, occupancy, room revenue, ADR, RevPAR, food and beverage revenue, other revenue, total revenue, labor cost, labor cost percentage, guest issues, no-shows, and complimentary rooms through the selected Dashboard date.
How does the workbook identify overdue incidents?
The Incident Log compares the follow-up due date with the current date. An unresolved item can be labeled No Due Date, Overdue, Due Today, or Open. Incidents with a status of Resolved or Closed are labeled Completed.
What do the workbook colors mean?
Pale yellow indicates user entry, and blue-gray indicates a calculated value. Green identifies favorable or completed results, amber signals that review is recommended, and red marks an exception or action required.
Transparent credits
Editorial and workbook QA bylines
The named editorial signatures and their responsibilities stay consistent across the library.

Workbook guide and editorial context
Maya Brooks
Maya Brooks is the consistent editorial byline for practical setup guidance written from each workbook’s final manifest and published features.
Meet the editorial byline →
Workbook structure and formula QA byline
Ethan Cole
Ethan Cole is the consistent QA byline shown only when recorded checks pass for worksheet structure, formulas, validations, recalculation, and the published XLSX bytes.
See the QA byline and checks →