Revenue · XLSX
Free 2026 Hotel Break-Even Calculator Spreadsheet Excel Template
Hotel break-even calculator spreadsheet for planning occupancy, revenue, costs, contribution margin, and target profit by month.
Formula and workbook structure checked before publication
This hotel break-even calculator spreadsheet is a free Excel template for evaluating monthly operating break-even and profitability. It connects room inventory, occupancy, average daily rate, food-and-beverage revenue, other revenue, variable costs, fixed costs, and target operating profit.
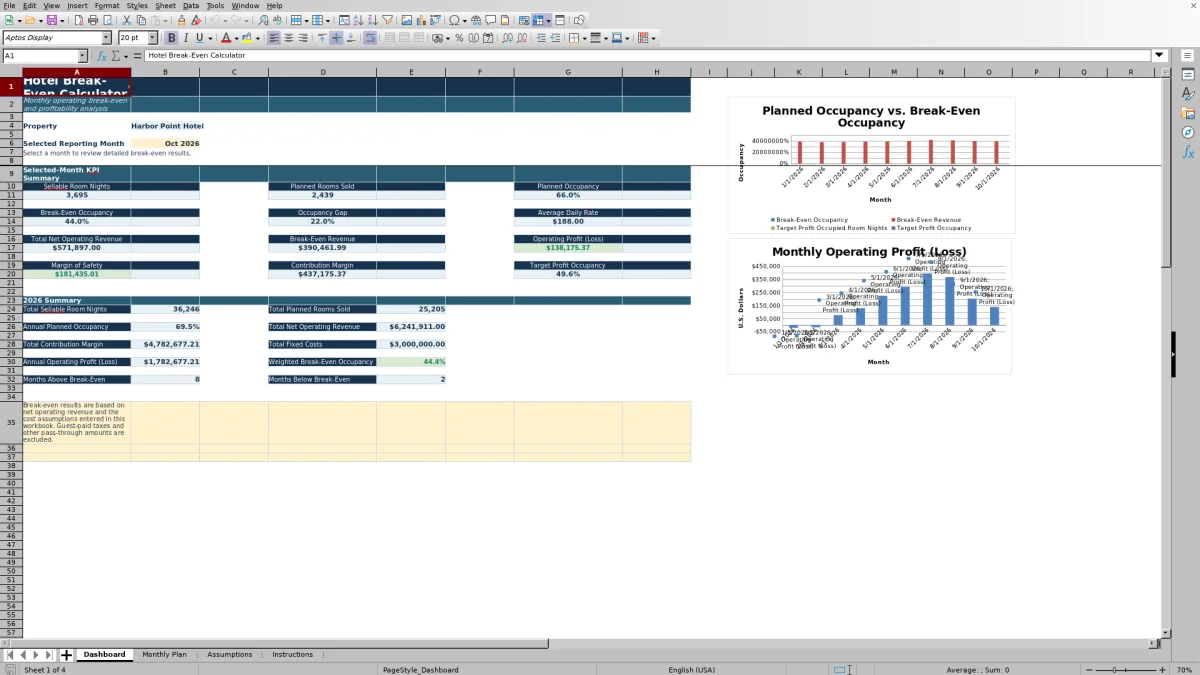
The workbook includes Dashboard, Monthly Plan, Assumptions, and Instructions sheets. Use it to compare planned occupancy with break-even occupancy, review operating profit or loss, and identify the occupancy required to reach a monthly profit target.
Results are based on net operating revenue and the assumptions entered in the file. Guest-paid taxes and similar pass-through amounts are excluded from the calculations.
At a glance
What this workbook helps you manage
- Calculates monthly break-even occupancy from sellable room nights, revenue, variable costs, and fixed costs.
- Compares planned occupancy with break-even and target-profit occupancy.
- Separates room, food-and-beverage, other revenue, variable costs, and fixed operating costs.
- Summarizes selected-month KPIs and 2026 planning results on one Dashboard.
See the actual file
Inside the workbook
Included in the file
- Four sheets: Dashboard, Monthly Plan, Assumptions, and Instructions.
- A 120-row Monthly Plan table with filters and validated input fields.
- Monthly defaults and optional overrides for four variable-cost assumptions.
- Dashboard month selector, conditional formatting, KPI summaries, and two charts.
How to use the template
1. Set the property assumptions
Open the Assumptions sheet and enter the property name, property type, reporting year, and default cost assumptions. Monetary values are presented in U.S. dollars.
- Default room variable cost per occupied room
- Default distribution commission rate
- Default food-and-beverage variable cost rate
- Default other revenue variable cost rate
The sheet also includes internal thresholds for occupancy warnings, minimum margin of safety, and high out-of-order room-night rates.
2. Enter one row for each month
On the Monthly Plan sheet, use the first day of the month in the Month field and assign a Plan Status of Actual, Forecast, or Budget. Enter rooms in inventory, days open, out-of-order room nights, planned occupancy, and average daily rate.
Add food-and-beverage revenue per occupied room, other monthly revenue, fixed payroll and benefits, other fixed operating costs, and target operating profit. Revenue inputs should be net of guest-paid lodging taxes, sales taxes, and similar pass-through amounts.
3. Use defaults or monthly overrides
Leave the override fields blank when the default assumptions apply. For an individual month, enter overrides for room variable cost, commission rate, food-and-beverage variable cost, or other revenue variable cost. The workbook then uses those values as the month’s effective variable-cost assumptions.
4. Review the calculated monthly results
The Monthly Plan calculates gross available and sellable room nights, planned rooms sold, revenue, variable costs, contribution margin, fixed costs, and operating profit or loss. It also calculates break-even occupied room nights, break-even occupancy, break-even revenue, target-profit occupancy, occupancy gap, and margin of safety.
5. Select a Dashboard reporting month
Choose a month in the Dashboard’s Selected Reporting Month field. Review the selected-month KPI summary, break-even status, 2026 summary, conditional formatting, and two charts based on Monthly Plan results.
How does the hotel break-even occupancy calculation work?
The spreadsheet first calculates gross available room nights from rooms in inventory and days open. It subtracts out-of-order room nights to determine sellable room nights, then applies planned occupancy to estimate rooms sold.
Contribution margin equals total net operating revenue less variable costs. Room contribution reflects average daily rate after distribution commissions, food-and-beverage contribution associated with occupied rooms, and room-level variable cost. Other monthly revenue contributes after its applicable variable cost.
Break-even occupied room nights represent the occupied nights needed to cover the remaining fixed costs. Dividing that result by sellable room nights produces break-even occupancy. The workbook also calculates break-even revenue and compares planned occupancy with the break-even requirement.
What hotel revenue and cost inputs are included?
Monthly revenue planning covers room revenue, food-and-beverage revenue per occupied room, and other monthly revenue. Room revenue is calculated from planned rooms sold and average daily rate. Food-and-beverage revenue is tied to occupied room volume, while other revenue is entered as a monthly amount.
Variable-cost inputs include room variable cost per occupied room, distribution commission rate, food-and-beverage variable cost rate, and other revenue variable cost rate. Fixed costs are divided into fixed payroll and benefits and other fixed operating costs.
The Assumptions notes explain that interest, depreciation, owner distributions, and capital expenditures are excluded unless management intentionally includes them in other fixed operating costs. That makes a consistent operating-profit definition important when entering assumptions.
How can hotel teams use the monthly plan?
The Monthly Plan supports Actual, Forecast, and Budget status selections. Revenue management can update occupancy and average daily rate, while operations leaders can review out-of-order rooms and room-level variable costs. Food-and-beverage leaders can maintain revenue per occupied room and its variable cost rate.
Finance can update fixed payroll, other fixed operating costs, and target operating profit. The general manager can then review operating profit or loss, occupancy gap, margin of safety, break-even status, and operational checks.
After month-end, a Forecast or Budget row can be changed to Actual and its planning inputs replaced with final operating results. This creates a consistent structure for reviewing monthly performance without changing the calculated columns.
What does target-profit occupancy show?
Break-even occupancy identifies the occupancy required to cover the entered operating costs. Target-profit occupancy goes further by adding the monthly target operating profit to the amount that must be covered.
This allows operators to compare three distinct figures: planned occupancy, break-even occupancy, and target-profit occupancy. The occupancy gap shows the difference between the plan and break-even point, while margin of safety indicates the operating cushion above break-even.
If break-even occupancy or target-profit occupancy exceeds 100%, the entered revenue and cost structure cannot reach that result within the month’s sellable room-night capacity. Operators can then review ADR, ancillary revenue, out-of-order inventory, variable costs, fixed costs, or the target itself.
Questions about this workbook
What sheets are included in the hotel break-even calculator?
The workbook contains four sheets: Dashboard, Monthly Plan, Assumptions, and Instructions. The Dashboard presents selected-month KPIs and a 2026 summary. Monthly Plan holds inputs and calculations, Assumptions stores property defaults and management thresholds, and Instructions explains the workflow and formulas.
Can I distinguish actual results from forecasts and budgets?
Yes. Each Monthly Plan row includes a Plan Status field with Actual, Forecast, and Budget choices. The Instructions sheet recommends changing a period from Forecast or Budget to Actual after month-end and replacing planning inputs with final operating results.
Can variable-cost assumptions change by month?
Yes. The Assumptions sheet stores default rates and costs, while Monthly Plan provides override fields for room variable cost, distribution commissions, food-and-beverage variable costs, and other revenue variable costs. Blank override fields use the defaults.
How are out-of-order rooms handled?
The workbook subtracts out-of-order room nights from gross available room nights to calculate sellable room nights. Planned rooms sold, break-even occupancy, and target-profit occupancy are then evaluated against that sellable inventory.
What does the Dashboard display for a selected month?
The selected-month KPI summary displays sellable room nights, planned rooms sold, planned occupancy, break-even occupancy, occupancy gap, average daily rate, total net operating revenue, break-even revenue, operating profit or loss, margin of safety, contribution margin, and target-profit occupancy.
Transparent credits
Editorial and workbook QA bylines
The named editorial signatures and their responsibilities stay consistent across the library.

Workbook guide and editorial context
Audrey Whitmore
Audrey Whitmore is the consistent editorial byline for practical setup guidance written from each workbook’s final manifest and published features.
Meet the editorial byline →
Workbook structure and formula QA byline
Ethan Cole
Ethan Cole is the consistent QA byline shown only when recorded checks pass for worksheet structure, formulas, validations, recalculation, and the published XLSX bytes.
See the QA byline and checks →