Revenue · XLSX
Free 2026 Hotel Annual Operating Budget Spreadsheet Excel Template
Build a hotel annual operating budget with monthly account detail, staffing costs, room forecasts, GOP, and dashboard summaries.
Formula and workbook structure checked before publication
This free Excel template organizes a 2026 hotel annual operating budget across four connected worksheets: Dashboard, Operating Budget, Labor Plan, and Assumptions. It gives hotel operators one structured file for monthly revenue, expenses, staffing costs, and rooms forecasting.
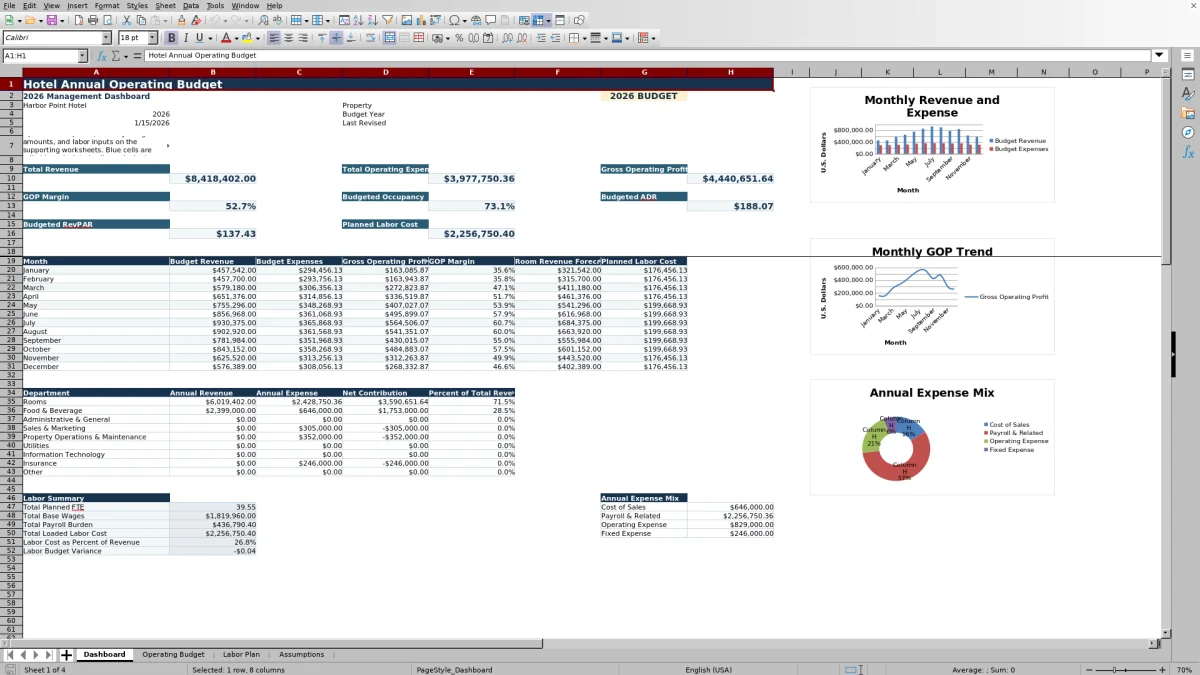
The workbook calculates annual account totals, monthly averages, gross operating profit, GOP margin, loaded labor cost, occupancy, ADR, and RevPAR from the information entered. A management dashboard summarizes monthly and departmental results for budget review.
Editable cells are shown in blue, calculated cells in gray, and selected review fields in gold. Built-in lists, review statuses, frozen panes, and filters help managers work through detailed operating assumptions without losing sight of the annual plan.
At a glance
What this workbook helps you manage
- Combines monthly hotel revenue, operating expenses, labor planning, and rooms assumptions in one workbook.
- Calculates annual budget totals, monthly averages, GOP, GOP margin, occupancy, ADR, and RevPAR.
- Separates editable inputs from calculated and review fields through consistent cell colors.
- Summarizes monthly and departmental budget results on a management dashboard with three charts.
See the actual file
Inside the workbook
Included in the file
- Four worksheets: Dashboard, Operating Budget, Labor Plan, and Assumptions.
- Operating Budget table with 150 account rows and January-through-December input columns.
- Labor Plan table with 120 position rows, monthly loaded costs, annual FTE, and manager notes.
- Assumptions-based monthly rooms forecast plus dashboard summaries and three charts.
How to use the template
1. Set the property assumptions
Begin on the Assumptions worksheet. Enter the property name, budget year, last revised date, room count, full-time weekly hours, and the editable payroll tax and benefit burden. These entries feed identifying information and calculations elsewhere in the workbook.
Complete the monthly rooms forecast before finalizing guest room revenue. The forecast uses monthly dates, room count, occupancy, and ADR inputs to calculate available room nights, occupied room nights, room revenue, and RevPAR. Review the occupancy and rate assumptions month by month so seasonal changes are reflected.
2. Build the monthly operating budget
Move to Operating Budget and work through the account table. Each row includes Active?, Account Code, Account Name, Department, Account Type, Budget Basis, Notes, and monthly amounts from January through December.
Use positive amounts for both revenue and expenses. Select the appropriate department, account type, and budget basis from the available lists, then enter monthly dollar amounts in the blue cells. The workbook calculates the annual budget, monthly average, percent of total revenue, and review status for each active line.
- Use Yes or No to control whether a line is active.
- Complete the setup fields for each account used in the budget.
- Review rows marked Missing setup or No annual amount.
- Use the table filters to focus on a department, account type, or status.
3. Enter the staffing plan
On Labor Plan, add active positions by department. Enter the position, employment type, pay type, planned headcount, average weekly hours, hourly rate or annual salary, and start and end months. Manager Notes are available for supporting context.
The worksheet calculates active months, annual base wages, payroll tax and benefit burden, annual loaded labor cost, monthly loaded cost, annual FTE, and review status. Hourly and salaried positions are handled according to the selected pay type. This provides a position-level labor plan for comparing staffing assumptions with the payroll budget recorded on Operating Budget.
4. Review calculated results
Use the Dashboard after assumptions, operating accounts, and labor inputs have been completed. Review total revenue, total operating expenses, gross operating profit, GOP margin, budgeted occupancy, budgeted ADR, budgeted RevPAR, and planned labor cost.
The monthly summary covers budget revenue, budget expenses, GOP, GOP margin, room revenue forecast, and planned labor cost. A separate department section reports annual revenue, annual expense, net contribution, and percent of total revenue. Check the monthly and department summaries for unexpected gaps before distributing the budget internally.
What does the hotel annual operating budget spreadsheet track?
The Operating Budget worksheet tracks active status, account code, account name, department, account type, budget basis, notes, and 12 monthly amounts. Calculated columns return the annual budget, monthly average, percent of total revenue, and review status.
Account types available through the workbook lists include Revenue, Cost of Sales, Payroll & Related, Operating Expense, and Fixed Expense. Department choices include Rooms, Food & Beverage, Administrative & General, Sales & Marketing, Property Operations & Maintenance, Utilities, Information Technology, Insurance, and Other.
At the top of the sheet, formulas summarize total revenue, total expenses, gross operating profit, and GOP margin. Only rows marked Yes in the Active? field are included in these totals, allowing unused budget lines to remain in the table without contributing to the results.
How does the spreadsheet support a monthly hotel budget?
Each operating account has a separate input for every month from January through December. This structure lets managers reflect seasonal demand, utility patterns, sales activity, repairs, insurance costs, and other timing differences directly in the annual plan rather than relying only on a flat annual amount.
The Dashboard places all 12 months in a side-by-side summary with budget revenue, budget expenses, gross operating profit, GOP margin, room revenue forecast, and planned labor cost. Two dashboard charts use the monthly summary data for revenue and expenses and for gross operating profit. The dashboard includes a third chart tied to another summary area.
Frozen panes keep identifying columns or monthly headers visible while users move through the detailed tables. The Operating Budget also includes an Excel table with filters across all listed fields, supporting a focused department or account review.
How are hotel labor costs calculated?
The Labor Plan supports Full-Time, Part-Time, Seasonal, and other employment-type choices included in the workbook lists. Pay type can be Hourly or Salaried. For each active position, users enter headcount and the applicable hours, rate, or salary information, along with start and end months.
Hourly base wages are calculated from planned headcount, average hours per week, the hourly rate, and the number of active months. Salaried base wages use planned headcount, annual salary per employee, and active months. The payroll tax and benefit burden from Assumptions is then applied to base wages to determine annual loaded labor cost.
Loaded cost is allocated across the active months. Summary fields show planned headcount, annual FTE, base wages, payroll burden, loaded labor cost, the payroll budget from Operating Budget, labor budget variance, and loaded labor cost as a percent of total revenue. This creates a consistent staffing cost view alongside the operating plan.
What hotel performance measures appear on the dashboard?
The Dashboard presents total revenue, total operating expenses, gross operating profit, and GOP margin. It also displays budgeted occupancy, ADR, RevPAR, and planned labor cost using information from the supporting worksheets.
Department summaries cover Rooms, Food & Beverage, Administrative & General, Sales & Marketing, Property Operations & Maintenance, Utilities, Information Technology, Insurance, and Other. For each department, the dashboard reports annual revenue, annual expense, net contribution, and percent of total revenue.
These views help operators examine the relationship between the rooms forecast, departmental budgets, labor assumptions, and the resulting gross operating profit. The dashboard is formula-driven, so revisions to supporting inputs flow into the displayed summaries.
Questions about this workbook
Which worksheets are included in this 2026 hotel budget template?
The workbook contains exactly four worksheets: Dashboard, Operating Budget, Labor Plan, and Assumptions. The supporting sheets feed calculated results to the Dashboard.
Can the spreadsheet calculate a full-year budget from monthly entries?
Yes. The Operating Budget sums January through December for each active account and calculates an annual budget and monthly average. Summary formulas then calculate annual total revenue, total expenses, gross operating profit, and GOP margin.
Does the workbook include a hotel rooms revenue forecast?
Yes. The Assumptions worksheet contains a monthly rooms forecast. It uses property room count and monthly occupancy and ADR inputs to calculate available room nights, occupied room nights, room revenue, and RevPAR.
How are payroll taxes and benefits handled?
The Assumptions worksheet includes an editable payroll tax and benefit burden. Labor Plan applies that percentage to calculated annual base wages and adds the burden to determine annual loaded labor cost.
How can managers identify incomplete budget lines?
The Operating Budget includes a calculated Review Status column. Active rows can display Missing setup when required setup fields are blank, No annual amount when the annual total is zero, or Ready when the row passes those checks. Labor Plan also includes a Review Status column for position entries.
Transparent credits
Editorial and workbook QA bylines
The named editorial signatures and their responsibilities stay consistent across the library.

Workbook guide and editorial context
Audrey Whitmore
Audrey Whitmore is the consistent editorial byline for practical setup guidance written from each workbook’s final manifest and published features.
Meet the editorial byline →
Workbook structure and formula QA byline
Ethan Cole
Ethan Cole is the consistent QA byline shown only when recorded checks pass for worksheet structure, formulas, validations, recalculation, and the published XLSX bytes.
See the QA byline and checks →