Revenue · XLSX
Hotel ADR RevPAR Calculator Spreadsheet: Free Excel Template for 2026
Hotel ADR RevPAR calculator spreadsheet with daily room data entry, automatic KPI calculations, target variances, checks, and dashboard trends.
Formula and workbook structure checked before publication
This hotel ADR RevPAR calculator spreadsheet is a free Excel template for tracking daily room inventory, rooms sold, room revenue, occupancy, average daily rate, and revenue per available room in 2026.
Enter operating data by business date on the Daily Performance sheet. The workbook calculates sellable rooms, occupancy, ADR, RevPAR, and variances from the targets entered on the Dashboard. An Operational Check column flags entries that may require review.
The three-sheet file combines daily hotel performance reporting, a date-controlled dashboard, and written instructions in one workbook. Source Reference and Notes fields provide space for manual traceability and operating context.
At a glance
What this workbook helps you manage
- Calculates occupancy, ADR, and RevPAR from daily room inventory, rooms sold, and room revenue.
- Summarizes selected reporting dates with period totals, KPI results, and target variances.
- Flags inventory and revenue combinations that may need operational review.
- Keeps source references, notes, day types, and performance figures together by business date.
See the actual file
Inside the workbook
Included in the file
- Three worksheets: Dashboard, Daily Performance, and Instructions.
- Daily Performance table with filters, frozen headers, validated inputs, and 366 entry rows.
- Automatic sellable rooms, occupancy, ADR, RevPAR, target variance, and operational check formulas.
- Dashboard with period KPIs, daily results, conditional formatting, and two charts.
How to use the template
1. Set the dashboard reporting assumptions
On the Dashboard, enter the property name, reporting start date, reporting end date, target occupancy, target ADR, target RevPAR, and out-of-order warning threshold. Yellow cells are intended for user input. The date fields accept dates beginning in 2026, and the dashboard displays a warning if the end date is earlier than the start date.
2. Enter one row for each business date
Use the Daily Performance sheet to enter the daily operating inputs:
- Business Date
- Day Type: Weekday, Weekend, Holiday, or Special Event
- Total Rooms
- Out-of-Order Rooms
- Rooms Sold
- Complimentary Rooms
- Room Revenue
- Source Reference and Notes, when useful
The sheet contains 366 entry rows. Its date validation covers 2026 through 2035, and room revenue is formatted in U.S. dollars.
3. Review calculated metrics and checks
Do not type over the blue or gray calculated fields. The workbook derives Sellable Rooms as Total Rooms minus Out-of-Order Rooms. It then calculates occupancy, ADR, and RevPAR, along with ADR and RevPAR variances from dashboard targets.
Read the Operational Check result for each date. Review issues such as rooms sold exceeding sellable rooms, complimentary rooms exceeding rooms sold, invalid inventory amounts, or a mismatch between room revenue and rooms sold. Correct an input when appropriate or explain the situation in Notes.
4. Analyze the selected period
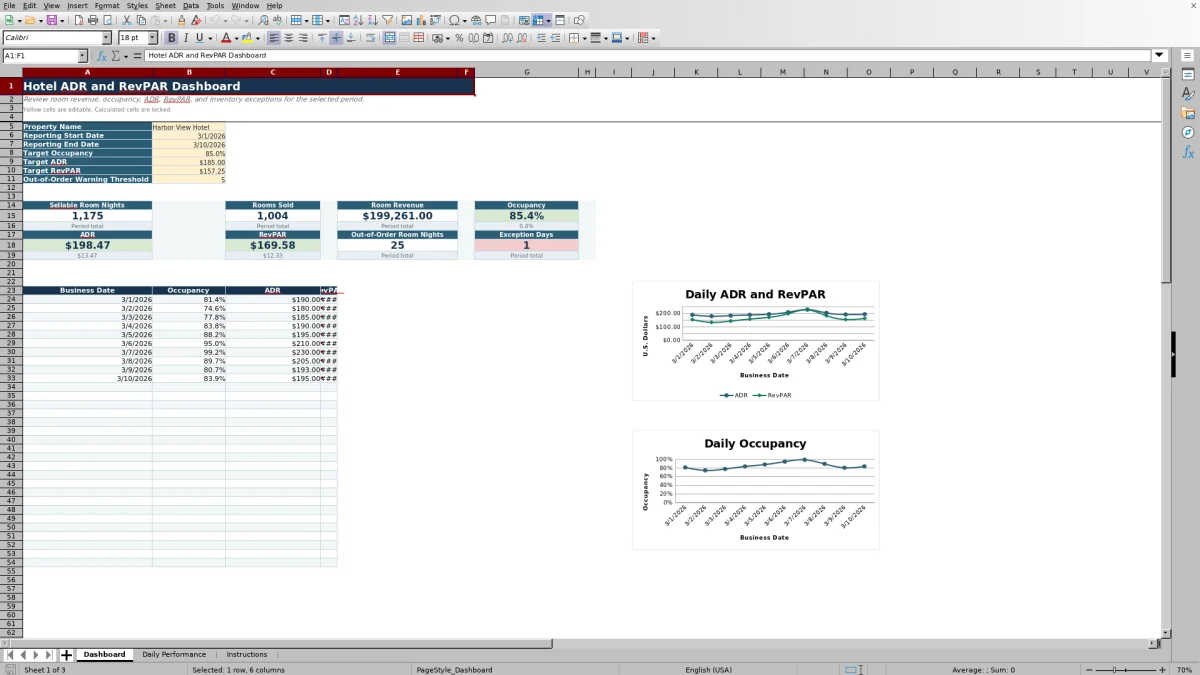
Return to the Dashboard and confirm the reporting dates. The summary uses records within that range to show sellable room nights, rooms sold, room revenue, occupancy, ADR, RevPAR, out-of-order room nights, and exception days. Compare the results with the property’s operating targets and review the daily trend area and charts.
How does the hotel ADR calculator work?
ADR measures room revenue per room sold. The Daily Performance sheet calculates ADR as Room Revenue divided by Rooms Sold for each entered business date. The Dashboard calculates period ADR by dividing room revenue for the selected date range by rooms sold for that same range.
For example, the workbook treats room revenue and rooms sold as operator-supplied figures. Hotels should apply their established reporting definitions consistently from one date to the next. Complimentary Rooms are recorded separately for visibility, while the ADR formula uses Rooms Sold as entered.
How is hotel RevPAR calculated in the spreadsheet?
RevPAR measures room revenue against available sellable inventory. The workbook calculates RevPAR as Room Revenue divided by Sellable Rooms. Sellable Rooms are calculated by subtracting Out-of-Order Rooms from Total Rooms.
The Dashboard rolls these figures into a selected-period result by dividing total room revenue in the reporting range by total sellable room nights. This approach preserves the relationship between revenue and available inventory across dates with different out-of-order counts.
What hotel performance information appears on the Dashboard?
The Dashboard summarizes sellable room nights, rooms sold, room revenue, occupancy, ADR, RevPAR, out-of-order room nights, and exception days for the selected start and end dates. It also compares occupancy, ADR, and RevPAR with the editable targets.
A daily section lists Business Date, Occupancy, ADR, and RevPAR. Two charts use the first ten displayed dates: one charts ADR and RevPAR, and the other charts occupancy. Conditional formatting distinguishes on-target results, items recommended for review, and data issues or below-target results.
How can hotel teams review inventory and data exceptions?
The Operational Check column evaluates each populated daily row for conditions that may make the calculations unreliable or require explanation. These include nonpositive total rooms, negative out-of-order rooms, out-of-order rooms above total rooms, no sellable rooms, rooms sold above sellable rooms, and complimentary rooms above rooms sold.
Teams should also review a date showing room revenue without rooms sold or rooms sold without room revenue. The Dashboard counts populated check results other than OK as exception days within the selected period. The out-of-order warning threshold is an editable operating assumption, not a legal requirement.
Questions about this workbook
What sheets are included in the hotel ADR RevPAR calculator spreadsheet?
The workbook contains Dashboard, Daily Performance, and Instructions sheets. The Dashboard provides period reporting, the Daily Performance sheet holds daily records and calculations, and the Instructions sheet explains setup, metric definitions, operating notes, formulas, and the color guide.
Which cells should hotel staff update?
Use the yellow input cells. On the Dashboard, enter the property name, reporting dates, targets, and out-of-order warning threshold. On Daily Performance, enter the business date, day type, inventory figures, rooms sold, complimentary rooms, room revenue, source reference, and notes. Blue or gray fields contain calculations and should not be overwritten.
Can the workbook compare actual ADR and RevPAR with targets?
Yes. Enter target ADR and target RevPAR on the Dashboard. The Daily Performance sheet calculates each date’s variance from those targets, while the Dashboard reports selected-period ADR and RevPAR results and their variances. Target occupancy is also available for comparison.
Does Source Reference connect to another hotel system?
No. Source Reference is a manual text field for recording an internal report name, document number, or other reference. It does not represent an automated integration. The adjacent Notes field can hold up to 500 characters of operating context.
What should be checked before relying on the dashboard totals?
Confirm that the start date is not later than the end date, use one record per business date, and review possible duplicate dates. Check the Operational Check column, verify that rooms sold do not exceed sellable rooms, and confirm that complimentary rooms do not exceed rooms sold. Apply consistent definitions for room revenue and rooms sold throughout the reporting period.
Transparent credits
Editorial and workbook QA bylines
The named editorial signatures and their responsibilities stay consistent across the library.

Workbook guide and editorial context
Audrey Whitmore
Audrey Whitmore is the consistent editorial byline for practical setup guidance written from each workbook’s final manifest and published features.
Meet the editorial byline →
Workbook structure and formula QA byline
Ethan Cole
Ethan Cole is the consistent QA byline shown only when recorded checks pass for worksheet structure, formulas, validations, recalculation, and the published XLSX bytes.
See the QA byline and checks →